Monarch Dashboard#
The Monarch Dashboard is a web-based GUI for monitoring Monarch actor systems in real time. It connects to the distributed telemetry system and renders the full mesh topology — hosts, processes, actor meshes, and individual actors — as interactive views with live-updating metrics, message traffic analysis, and a full DAG visualization.
See the observability overview for how the dashboard uses distributed telemetry and complements the Mesh Admin TUI.
Note — The Monarch Dashboard is in early development and may change significantly between releases.
The dashboard is included in the torchmonarch PyPI package. The telemetry
sidecar hosts its query service. Set
TelemetryConfig(include_dashboard=True) to advertise the browser UI and print
its URL.
Quick Start#
Start any Monarch application that enables telemetry. The Dining Philosophers example is the easiest way to try it — five philosopher actors share chopsticks around a table, mediated by a waiter actor that prevents deadlock.
Terminal 1 — start the example with the dashboard enabled:
python python/examples/dining_philosophers.py --dashboard
The example prints the dashboard URL on startup:
Monarch Dashboard: http://localhost:8265
Open http://localhost:8265 in your browser.
Summary View#
The default view provides at-a-glance metrics for the entire mesh.
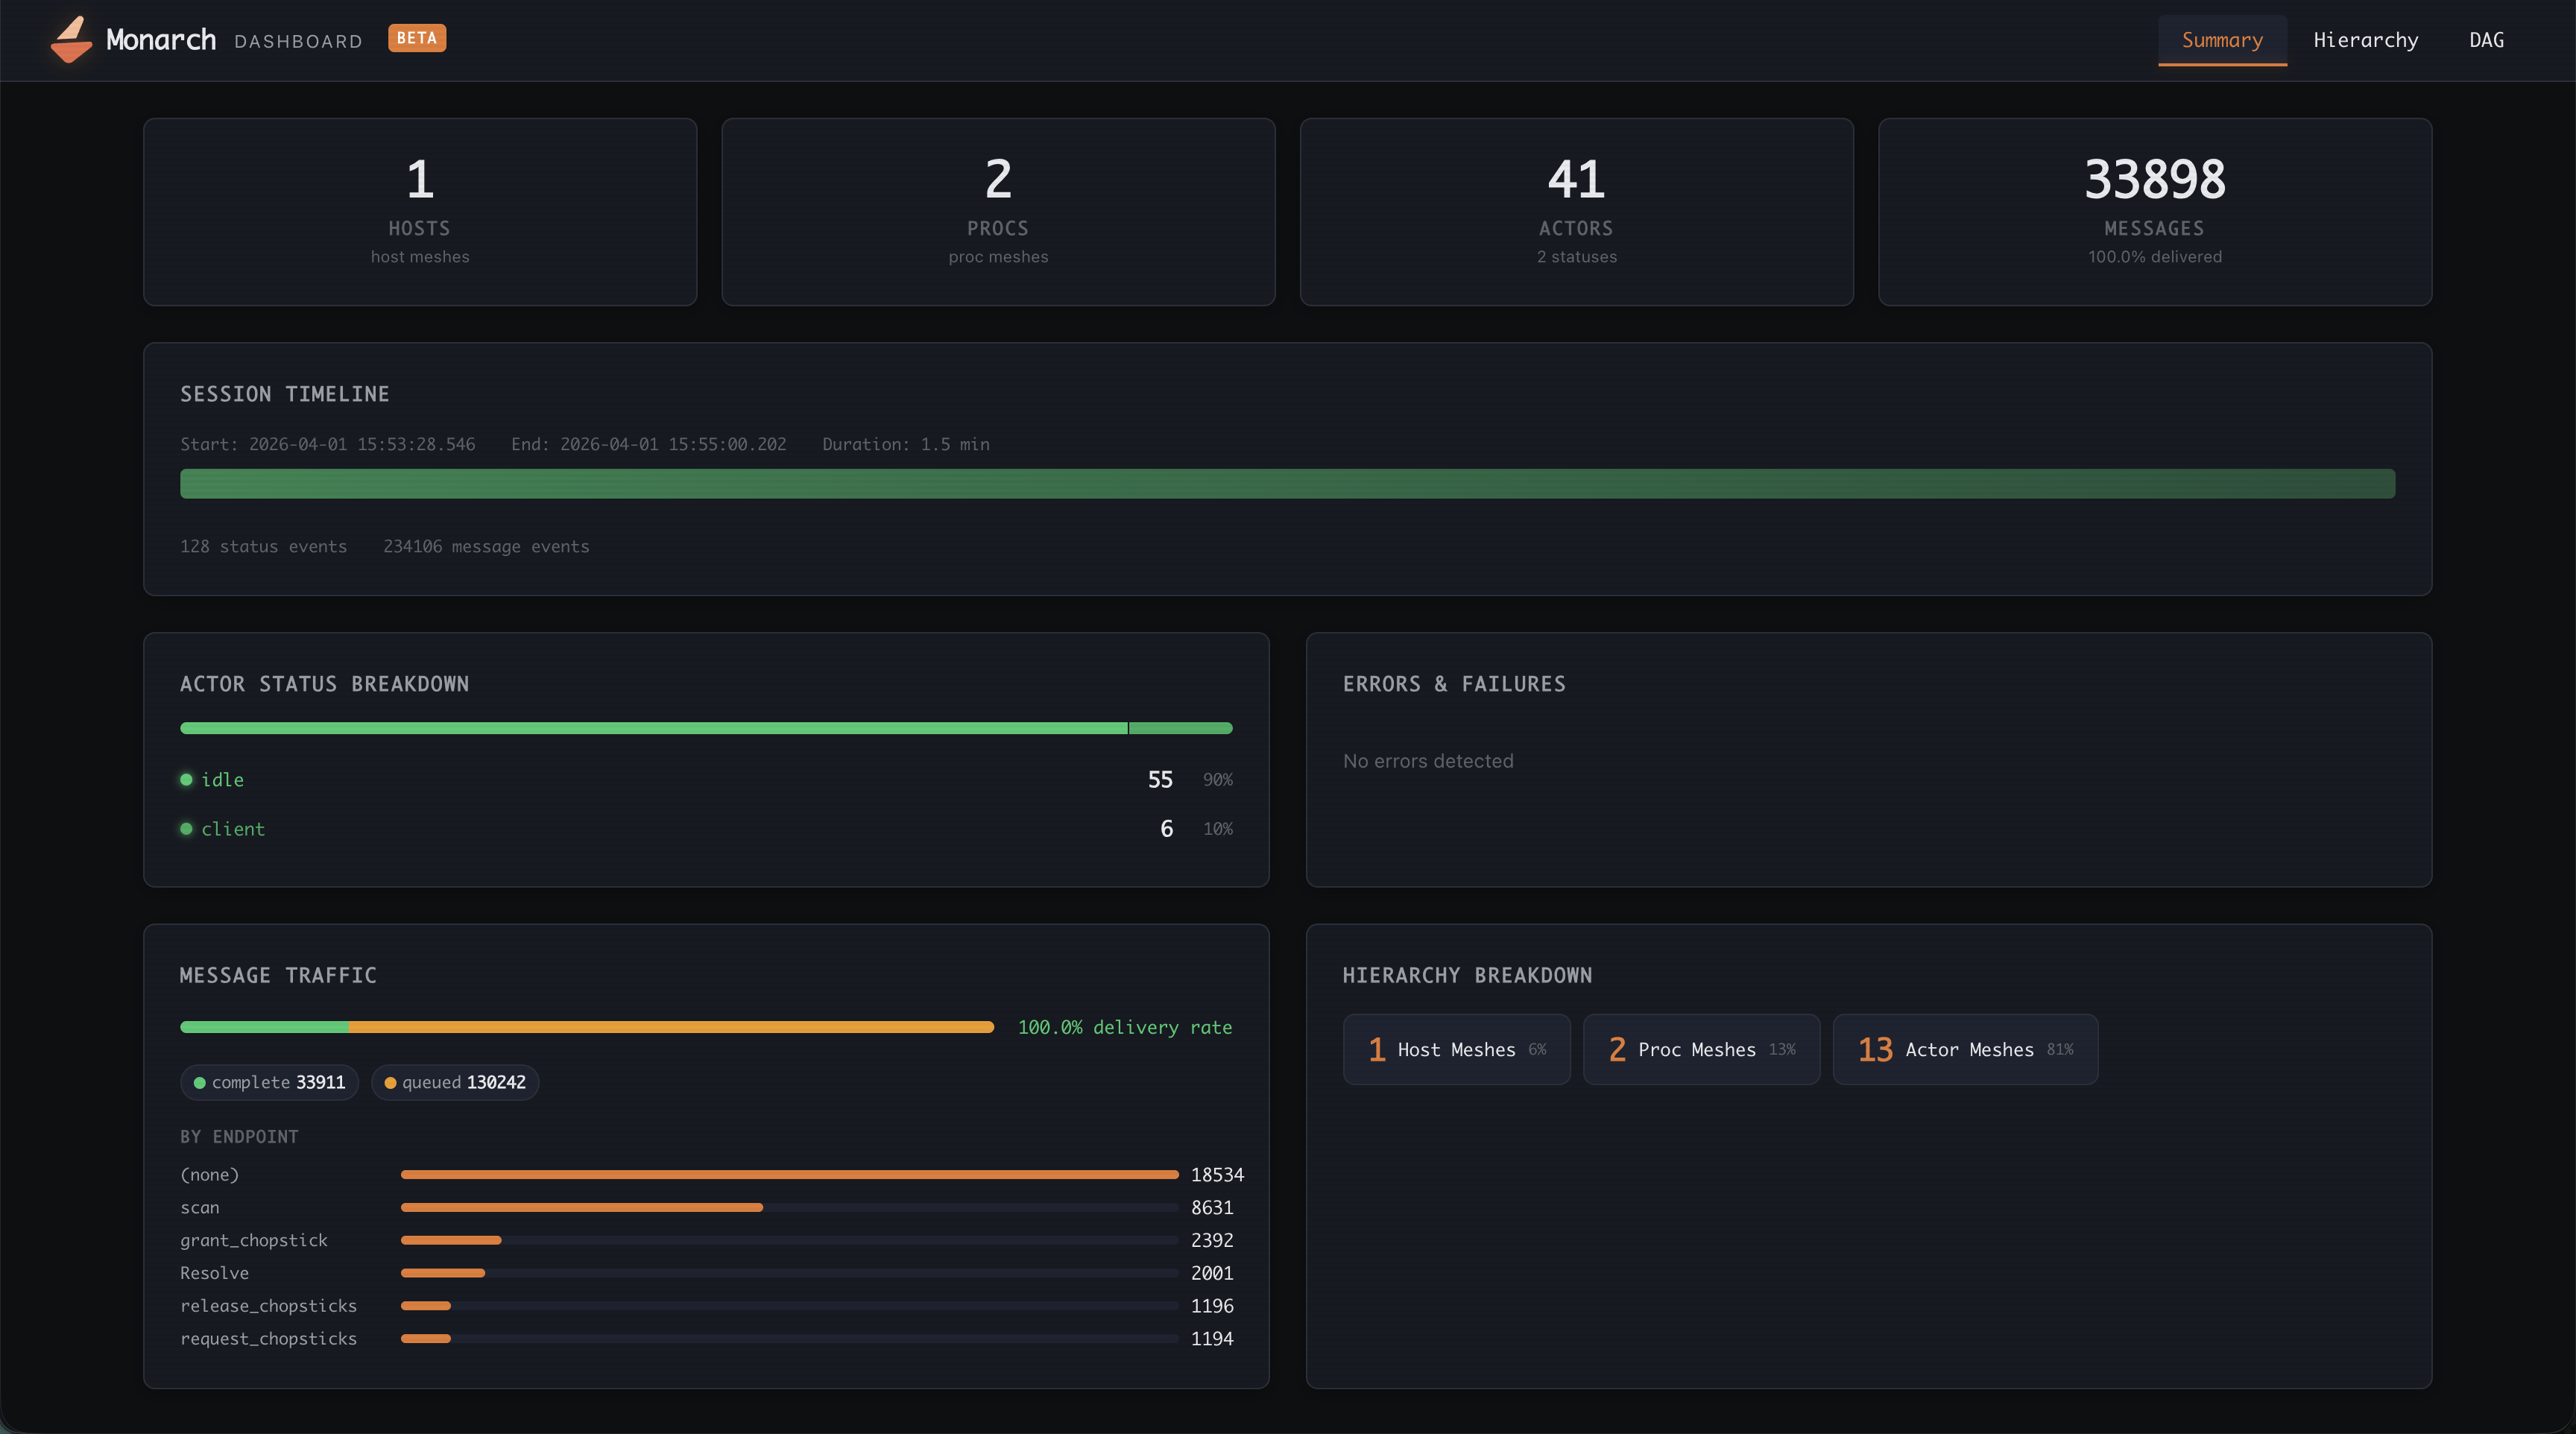
The summary is organized into sections:
Overview cards — host mesh count, proc mesh count, total actors (with status count), and total messages (with delivery rate percentage).
Session timeline — a horizontal bar spanning the session lifetime with error notches marking when actors failed or stopped.
Actor status breakdown — a segmented bar and legend showing how many actors are in each state (Running, Idle, Failed, Stopped, etc.).
Errors & failures — failed actors, stopped actors, and undelivered messages, each with the actor name, failure reason, and timestamp.
Message traffic — delivery rate bar segmented by message status, plus a ranked bar chart of messages by endpoint name.
Hierarchy breakdown — chip counts of host meshes, proc meshes, and actor meshes.
Hierarchy View#
The hierarchy view lets you drill down through the full Monarch mesh tree one level at a time. Click any row to navigate deeper; use the breadcrumb bar at the top to jump back to a parent level.
The navigation levels are:
Host Meshes
  └─ Host Units (individual hosts)
       └─ Proc Meshes
            └─ Proc Units (individual processes)
                 └─ Actor Meshes
                      └─ Actors
                           └─ Actor Detail
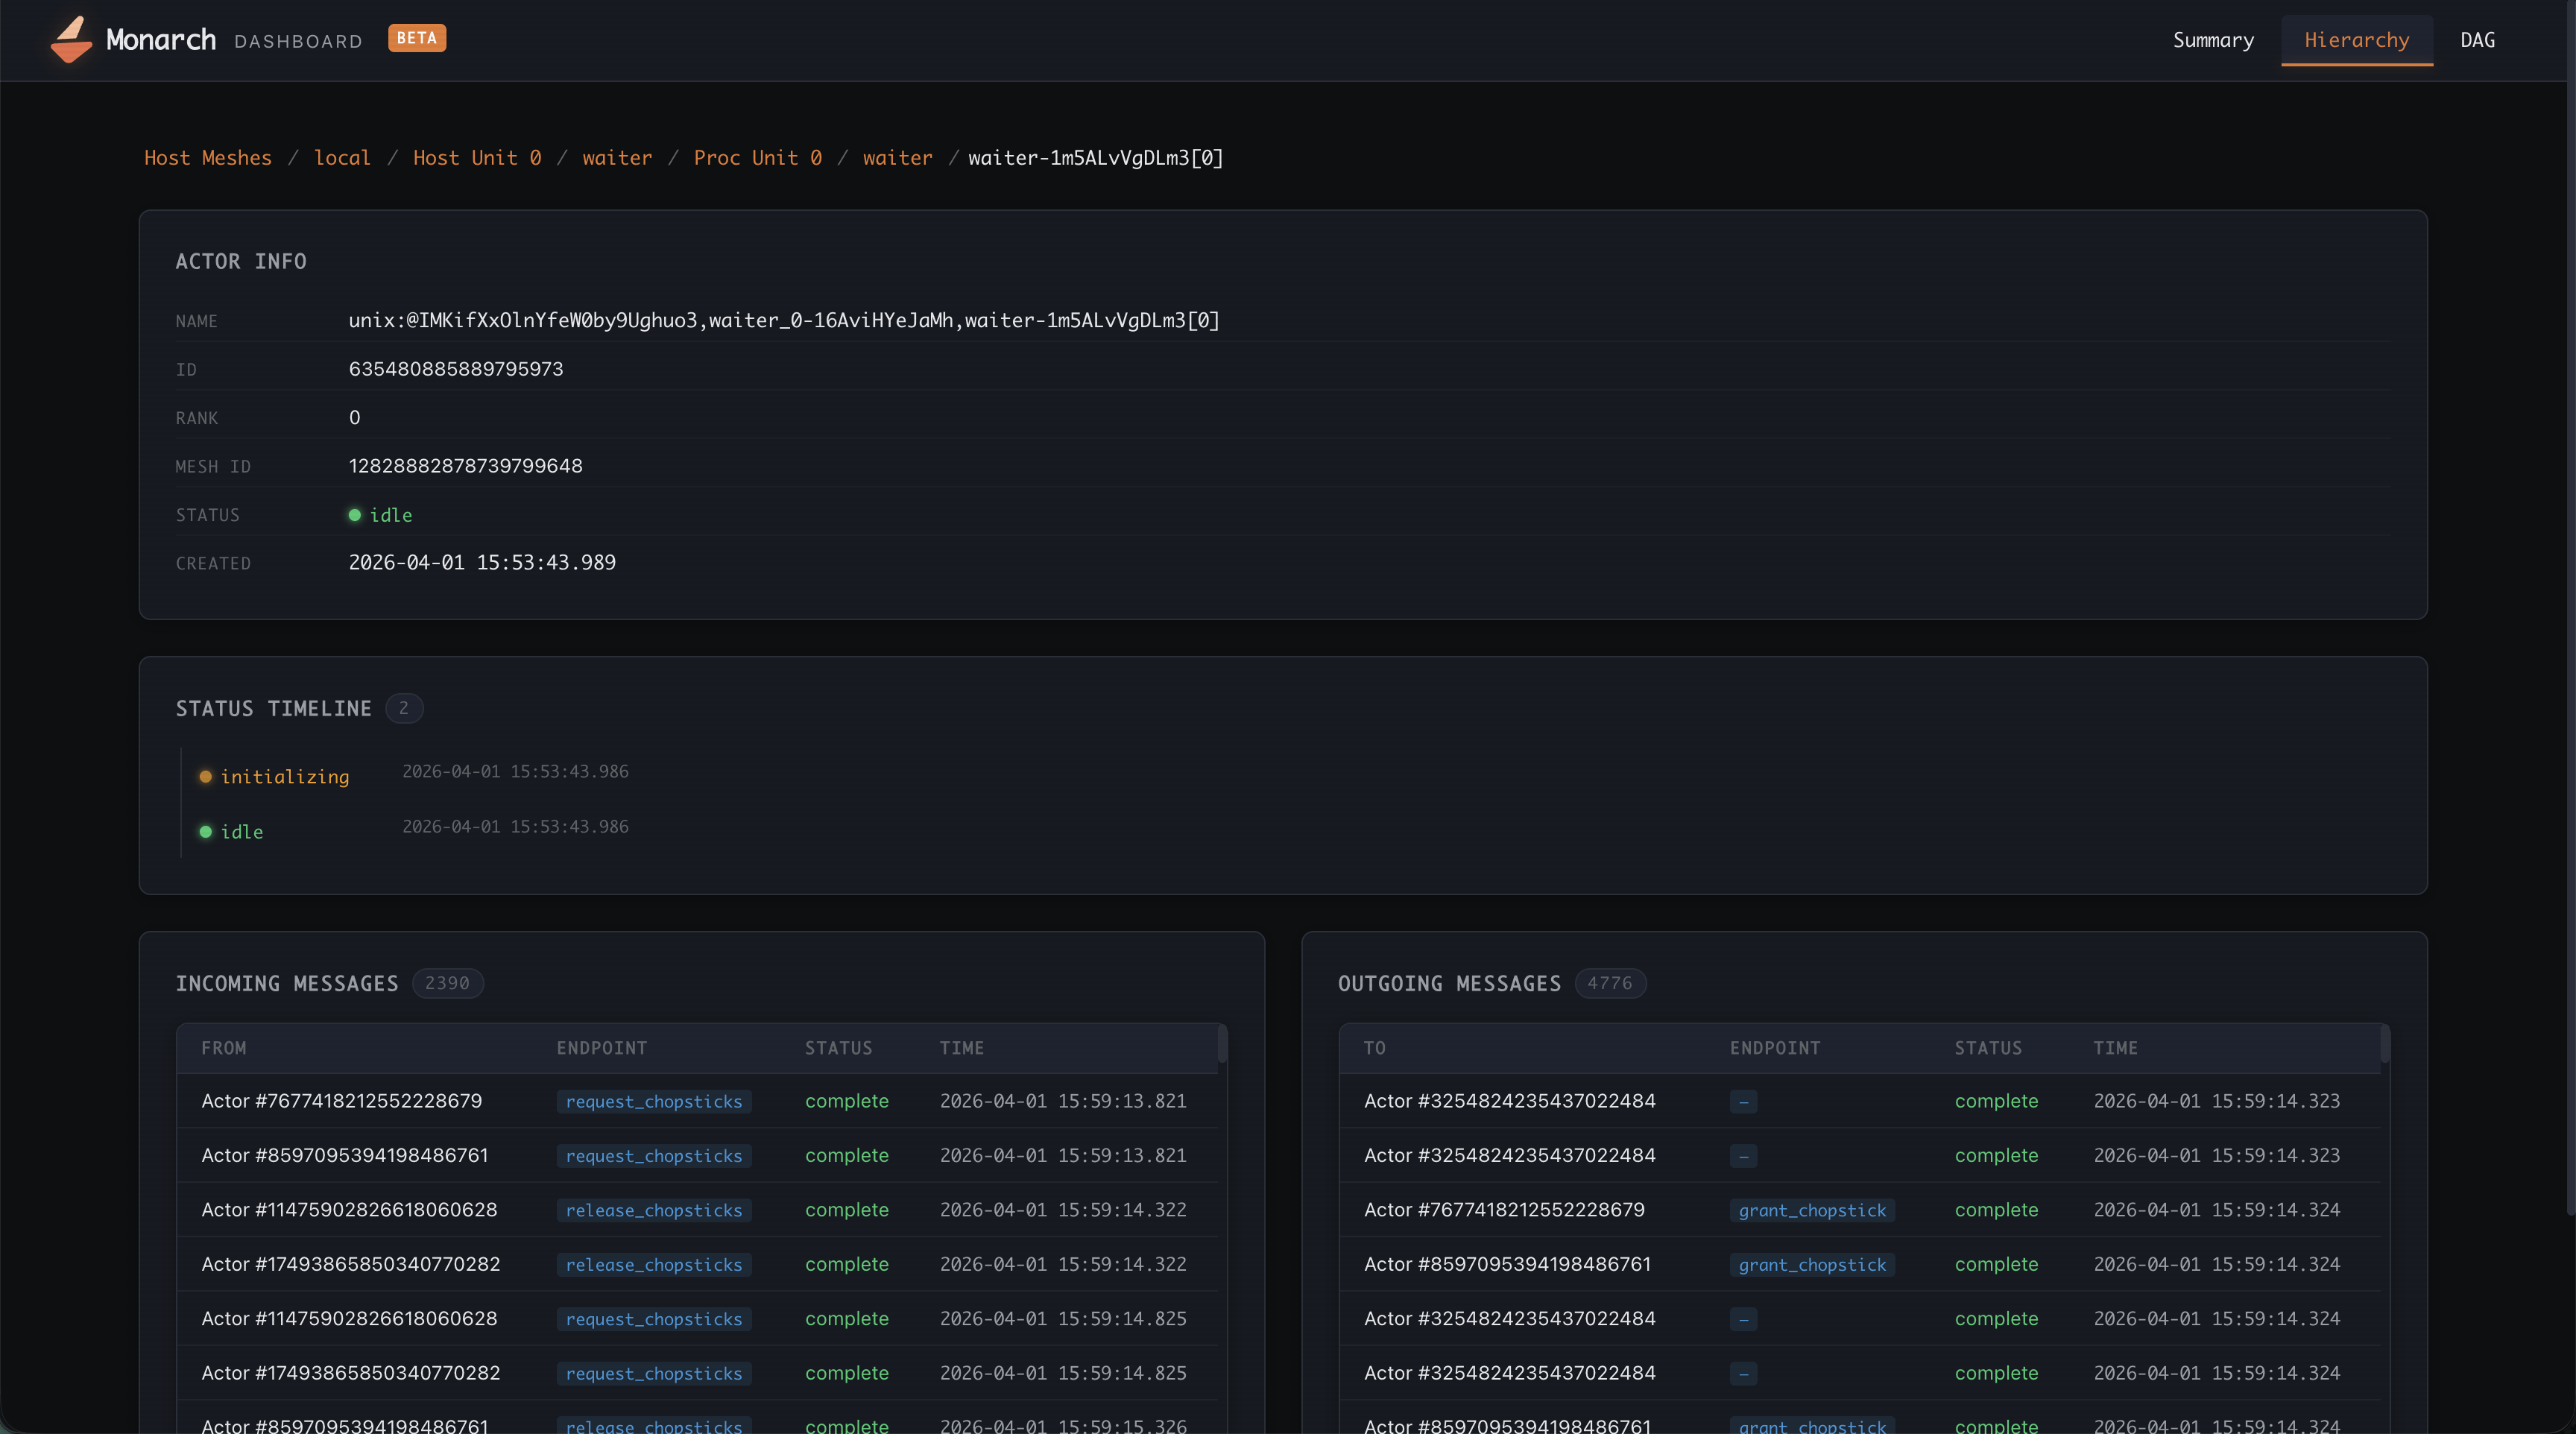
Actor Detail#
Selecting an individual actor opens its detail page with three sections:
Actor info — full name, ID, rank, mesh ID, current status, and creation timestamp.
Status timeline — chronological list of every status transition with timestamp and reason.
Messages — incoming and outgoing message tables showing sender/receiver, endpoint name, delivery status, and timestamp. Click any message to expand its full status event history (e.g. Sent → Delivered).
DAG View#
The DAG view renders the entire job as an interactive directed graph, helping you to understand your job better. It also shows message flows between your user actors.
Host → Proc → Actor
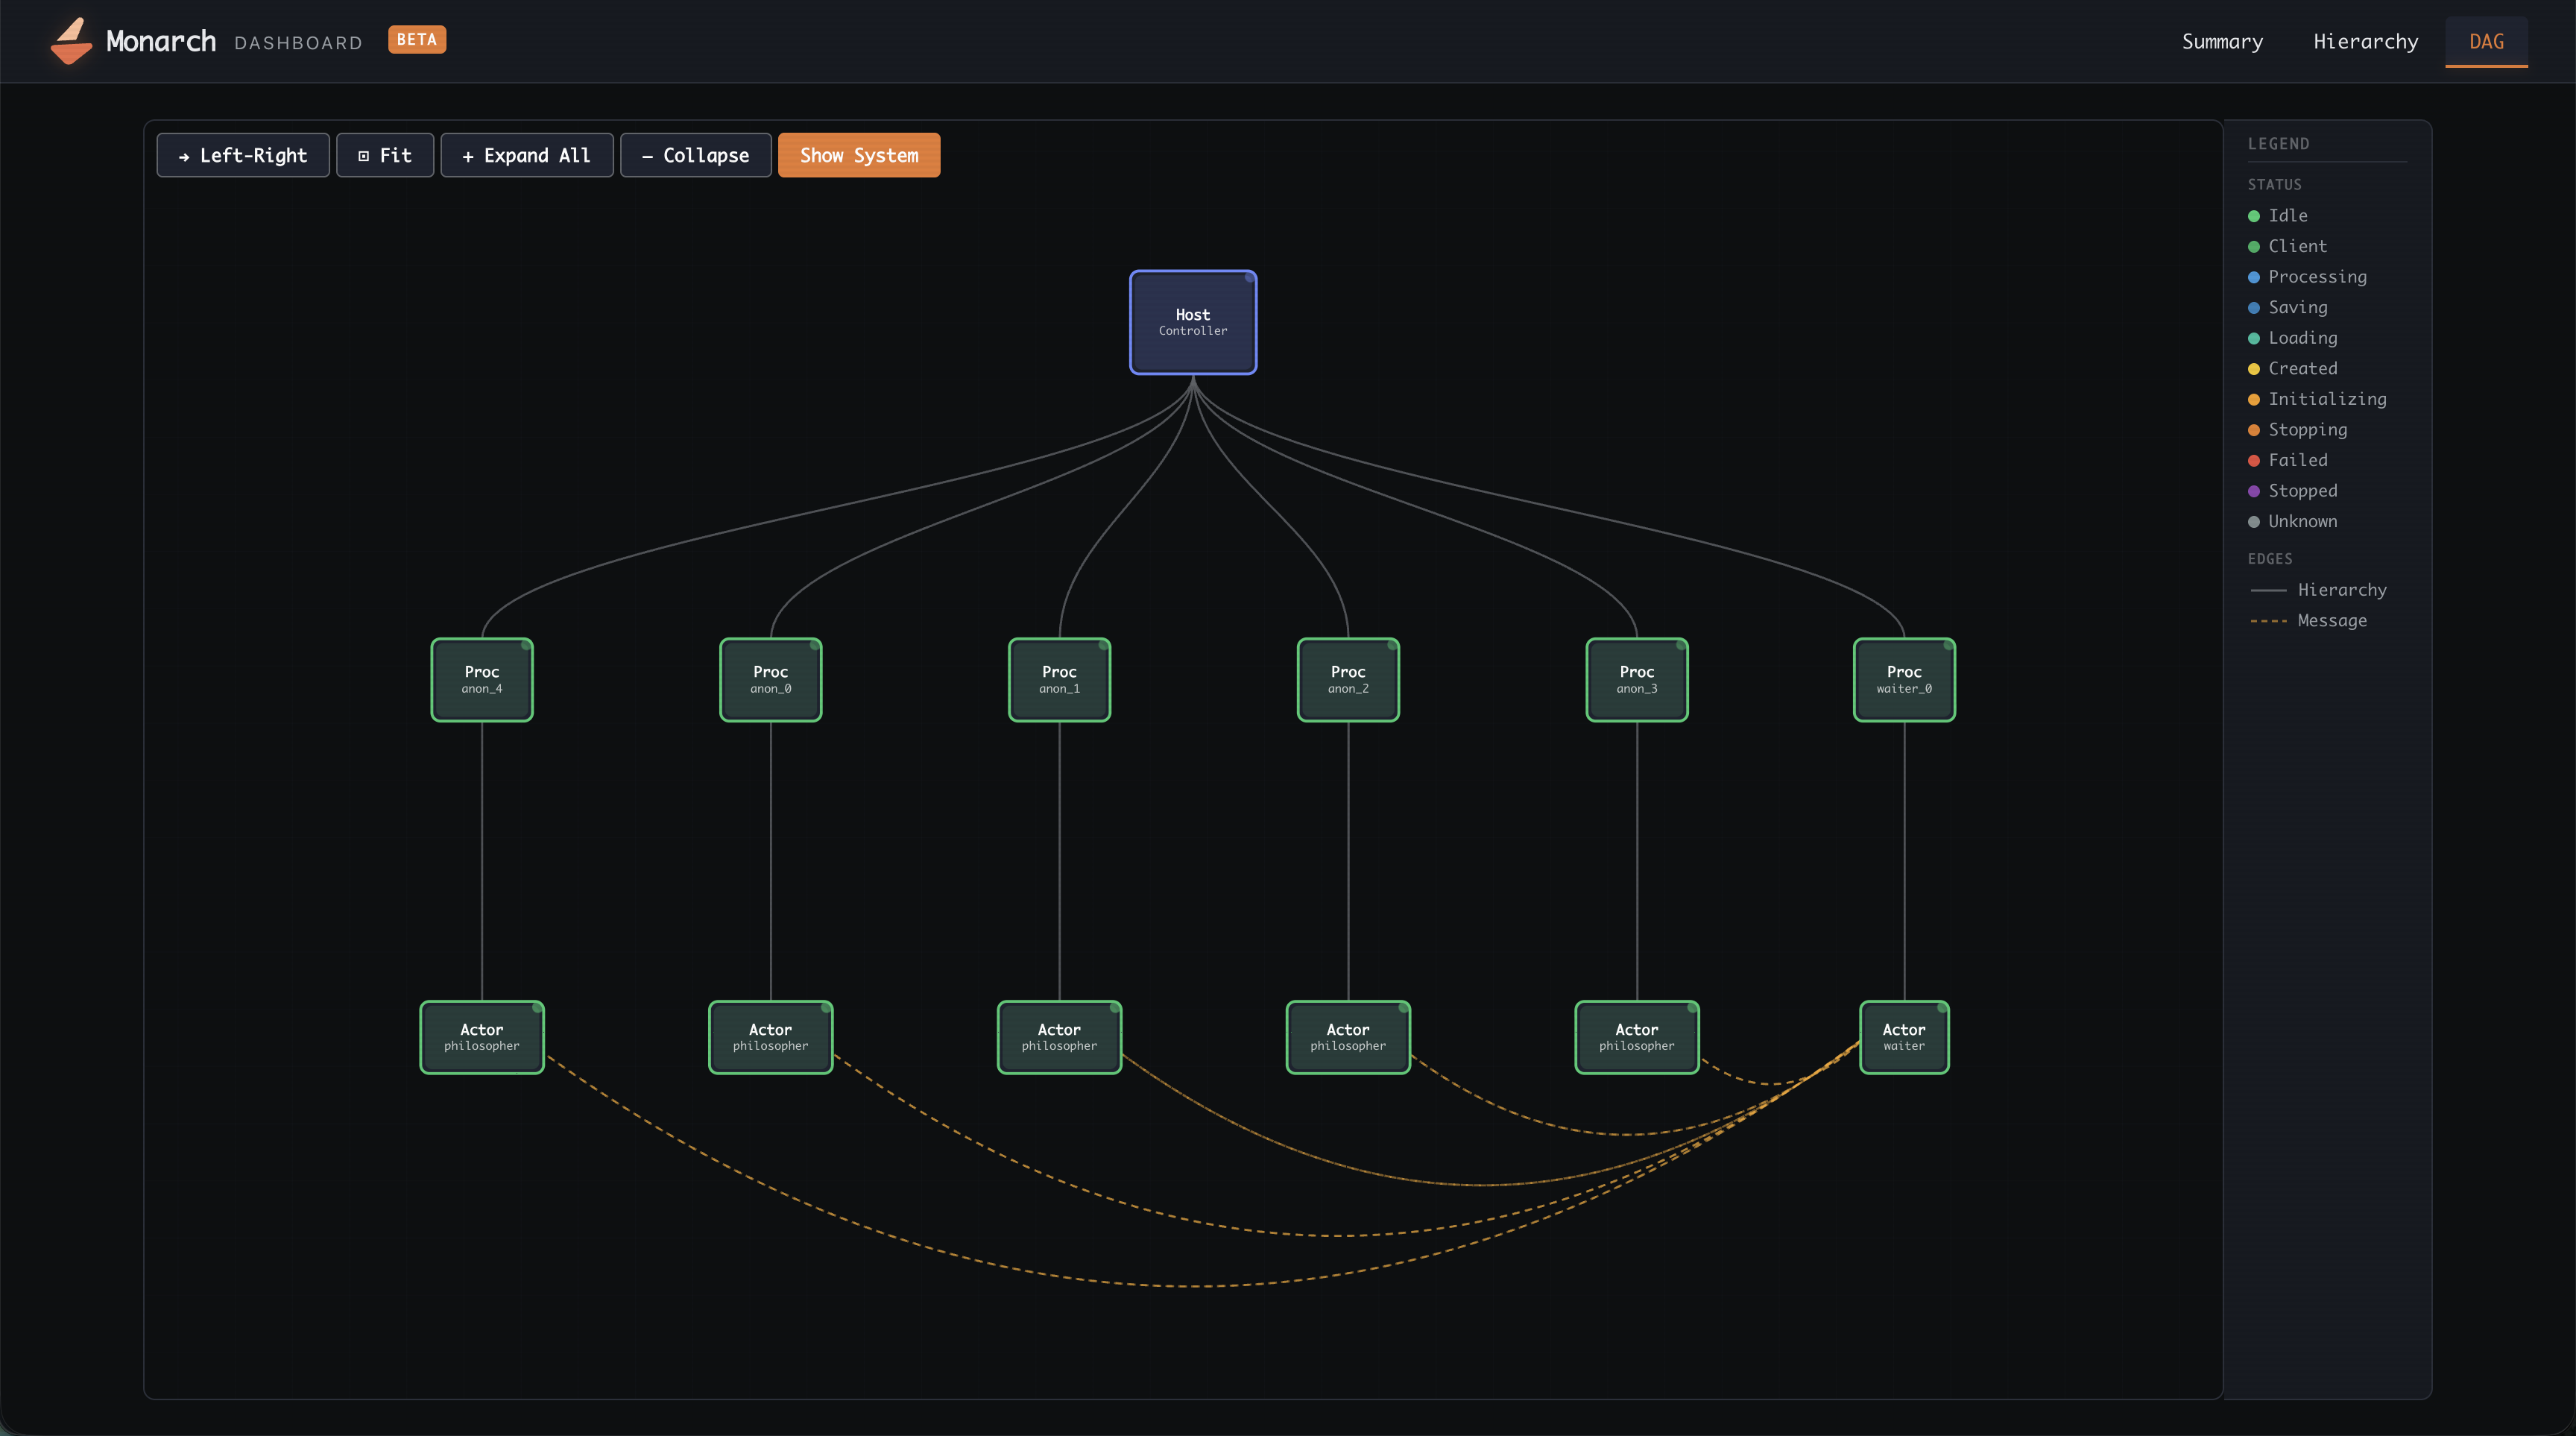
Nodes are color-coded by status (green = healthy, red = failed, gray = stopped).
Edges show parent-child relationships in the mesh hierarchy.
Pan by dragging the canvas; zoom with the scroll wheel.
Hover any node for a tooltip with its name, type, and status, and mesh.
Click a node to open its detail panel on the right.
Programmatic Usage#
Here is an example of how to enable the dashboard on your job via the Jobs API.
from monarch.job import ProcessJob, TelemetryConfig

job = (
    ProcessJob({"workers": 2})
    .enable_admin()
    .enable_telemetry(
        TelemetryConfig(include_dashboard=True, dashboard_port=8265)
    )
)
state = job.state(cached_path=None)
print(state.dashboard_url)
With both services enabled, the dashboard receives periodic mesh-admin
snapshots. Use state.query_engine_client to query the same data directly; see
Distributed Telemetry.